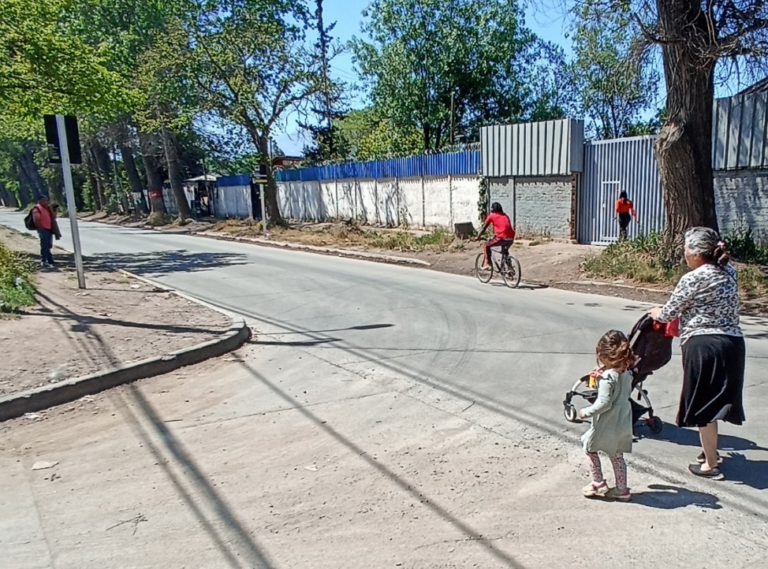
Health arguments are rarely used to justify urban policies in Latin America. A new urban health study suggests we can and should do better connecting
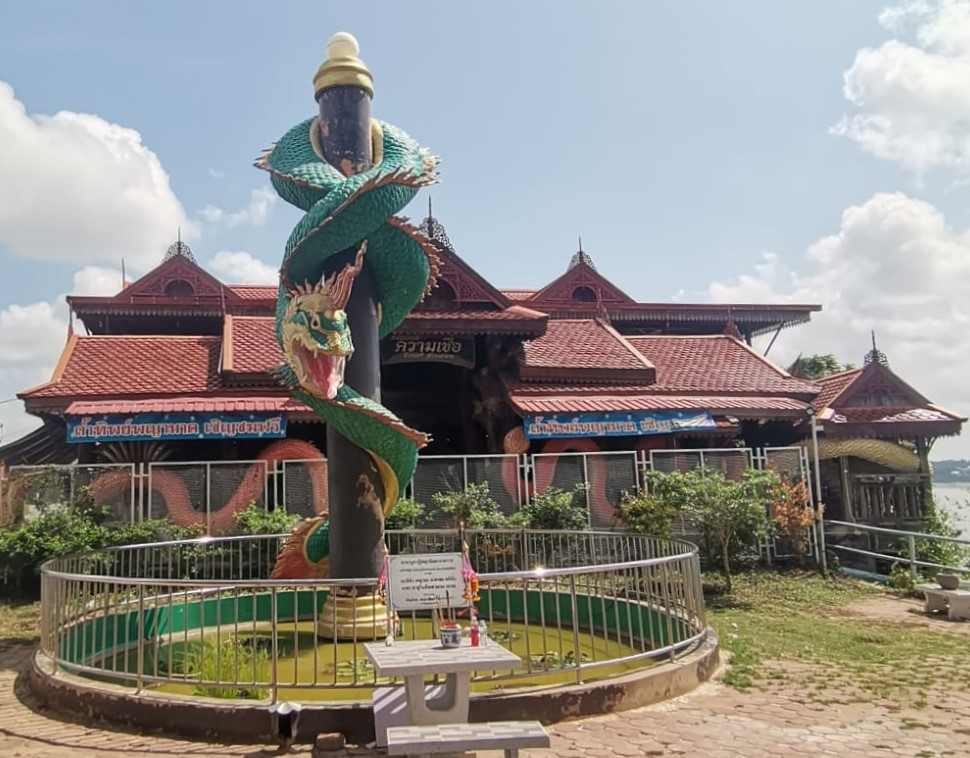
I use the travelogue methodology to investigate urban health and sustainable development in relation to the Mekong River in northeastern Thailand, revealing new insights and bringing travel to urban areas near the river into knowledge production.
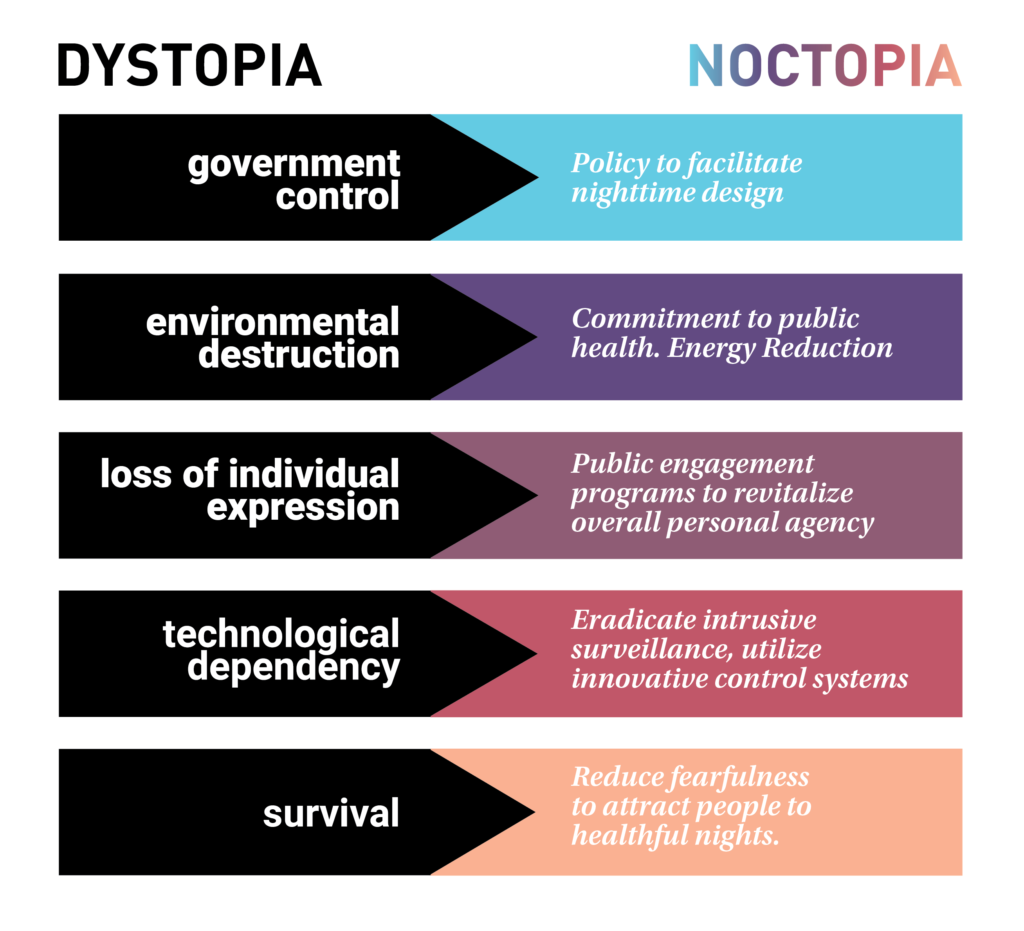
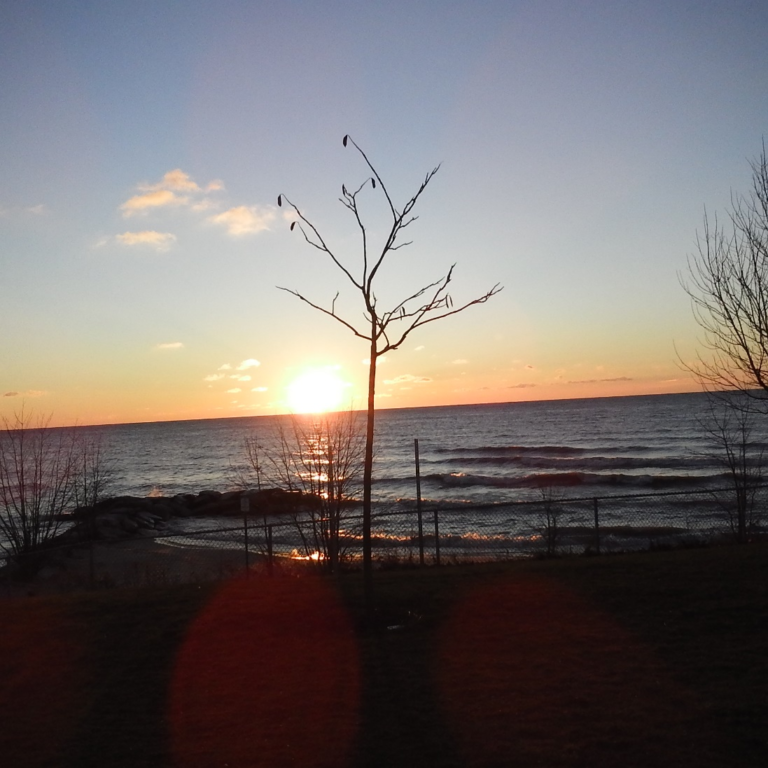
Dystopian frameworks portend the future. With climatic upheavals increasing, dystopia is now. Because of escalating urban heat and heat-related illness and death, this essay speculates a future that switches daily activities into the coolness of night: Noctopia.