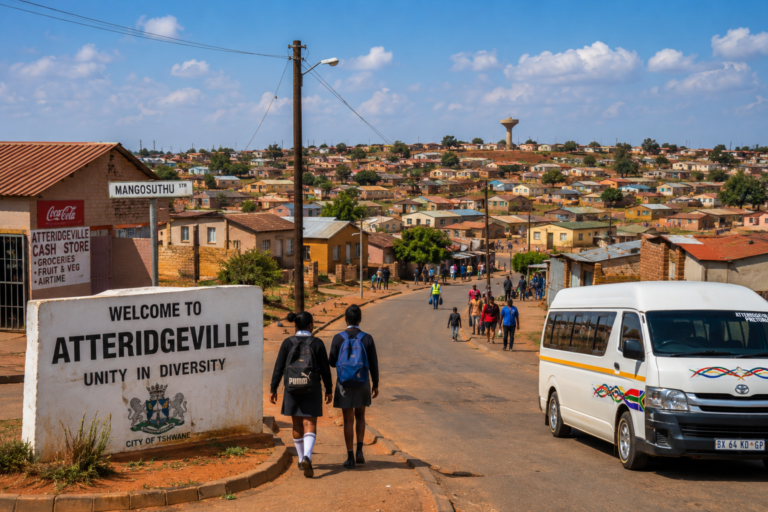


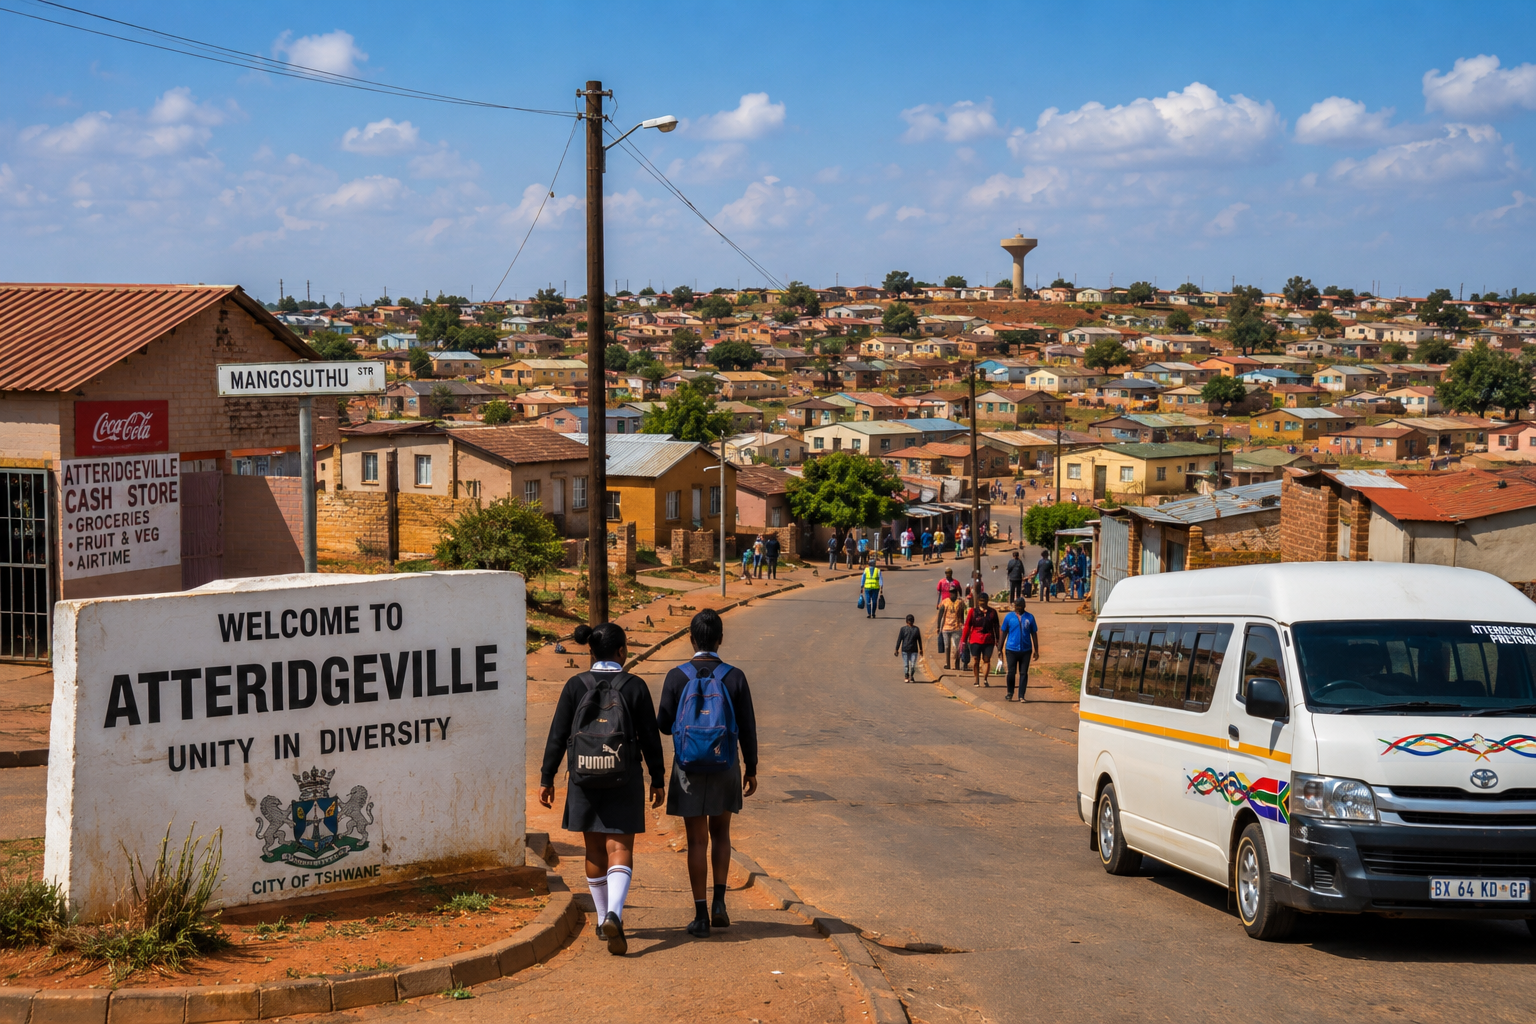

Extreme weather is not only a climate problem but also a housing problem. In Johannesburg’s low-income communities, where and how people live strongly shape who is affected when storms, floods, or heatwaves strike. This study shows why housing quality must be central to city climate planning.

Share

Target audience

We are writing for municipal housing and human settlements officials, urban climate resilience and disaster risk planners, and community development organisations working in informal and low-income settlements, particularly in cities facing growing climate stress.

The problem

Many low-income urban communities are increasingly exposed to extreme weather such as flooding, heavy storms, and heat. However, city responses often focus on emergency relief rather than on the housing conditions that make people vulnerable in the first place. Informal dwellings, overcrowded plots, and poorly constructed structures are common in rapidly urbanising areas. Without understanding how housing design and quality shape climate risk, cities struggle to protect the most vulnerable households.

What we did and why

We analysed household data from more than forty-six thousand households in low-income communities in Johannesburg. We focused on simple, practical housing features that city officials and planners already work with; whether homes are formal or informal, whether buildings have one or more floors, and whether households have one or multiple structures on a plot. We did this to identify which housing conditions increase or reduce exposure to extreme weather.

Our study’s contribution

This study shows clearly that housing quality matters for climate resilience. We found that:
• Households in informal dwellings are about three times more likely to be affected by extreme weather.
• Plots with multiple structures face higher risk, likely due to overcrowding and poor drainage.
• Multi-floor buildings are less affected, suggesting protective design features.
These findings provide practical evidence that cities can act on immediately.

Impacts for city policy and practice

We argue that climate adaptation in cities must go beyond emergency response and include housing improvement. City action should focus on:
• Upgrading informal dwellings using climate-resilient materials.
• Reducing overcrowding on residential plots.
• Promoting safer building designs, including vertical development where appropriate.
Investing in housing quality is not only a social issue but a cost-effective climate adaptation strategy.

Further information

Full research article:

[OPEN ACCESS] Housing conditions and extreme weather exposure in low-income communities in Gauteng Province, South Africa by Phoka C. Rathebe, Masilu D. Masekameni, Khuthatshelo Vincent Mphaga, Tintswalo Mercy Hlungwani and Themba Titus Sigudu.

Related posts

Huge crowd and its shadows

Walkability for all in our cities

To work for the Right to Walk the City is to advocate for health and social justice. Public Health as a multidisciplinary action is fundamental to achieve that goal. The ‘15-minute city’ model exemplifies this approach but remains hindered by barriers such as inadequate infrastructure and social discrimination, limiting walkability for underserved communities.
Read More »

Facilitating adaptation action: Interactive diagrams to support understanding and action on climate change 

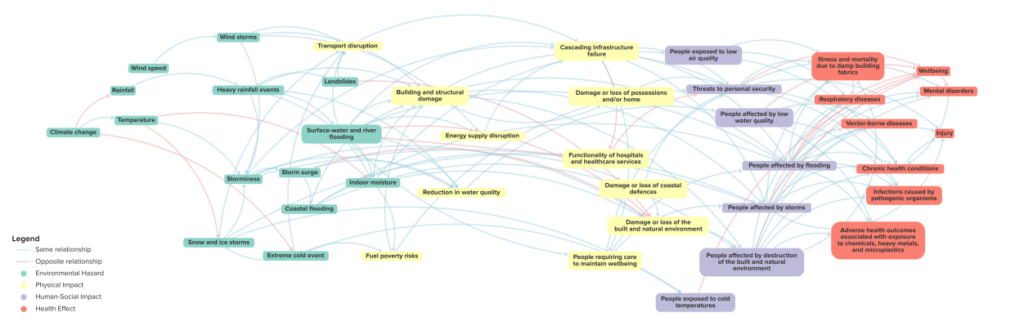
Climate change influences everybody in every sector. We gathered available evidence on the impacts of climate change and potential adaptations now and in the future in the UK. From this review, we developed systems diagrams that visualise the evidence in an accessible and interactive manner to facilitate the climate change planning process. These diagrams are part of the Local Climate Adaptation Tool (LCAT) which was co-produced with Cornwall Council and a National Stakeholder Group of local decision-makers. New interactive diagrams have been produced to show how and where climate change impacts occur, why they are interconnected, and their consequences on human health and wellbeing. These diagrams are part of the Local Climate Adaptation Tool (LCAT). 

Read More »